Analytics
Every site AURAFUSE publishes ships with a first-party tracker: a dependency-free script that reports straight into AURAFUSE's own database. No third-party pixels, no sampling, no data leaving your stack — the numbers are raw, real-time, and yours.
What gets tracked
The tracker watches previews and published sites alike:
- Pageviews — initial loads plus SPA navigations.
- Clicks — link clicks, flagged when outbound.
- Forms — form starts and submissions.
- Downloads — clicks on file links (PDF, ZIP, DOCX, ...).
- Scroll depth — a one-time deep-scroll event per page.
- Custom events — anything you emit via
window.trackEventor adata-analytics-eventattribute. - Geography and device — every event is stamped with the country it came from (derived from network geo headers on the server) and a coarse device class — desktop, tablet, or mobile — from the browser's user agent.
Visitors get an anonymous ID and a session ID; beacons are sent quietly without CORS preflight, and invalid events are dropped silently so a broken call can never pollute your data.
Traffic caps by plan
Paid plans include a monthly visit allowance per brand (a visit is a unique session within the calendar month); higher tiers are unlimited. If a brand reaches its cap, new events for that brand pause until the next month — your data stays accurate, just on hold.
The dashboard
The per-brand dashboard answers "how is my site doing?" at a glance:
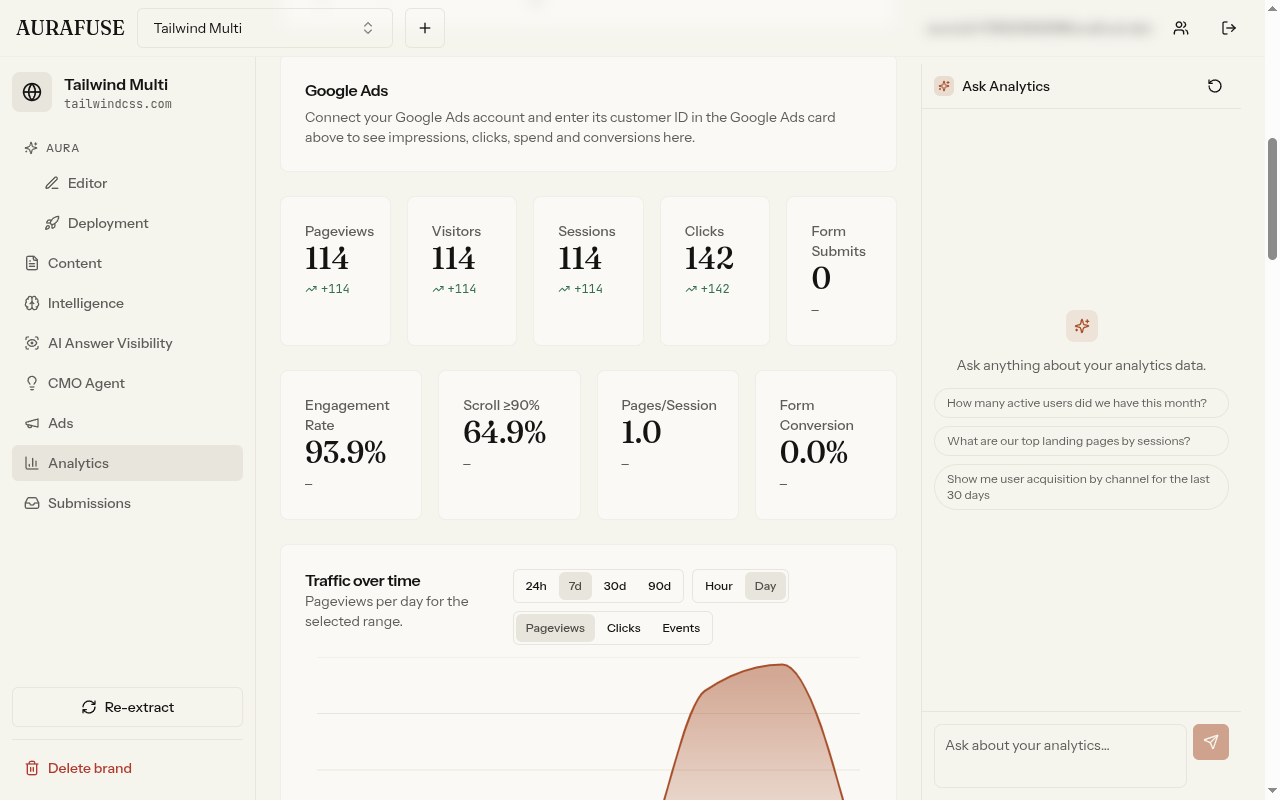
- Stat cards with deltas — pageviews, visitors, and events compared against the previous period, so movement is visible immediately.
- Time series — traffic over time with hour or day granularity.
- Top pages and referrers — what people view and where they come from.
- Live event feed — events streaming in as they happen.
Saved custom charts
Beyond the defaults, build custom charts from any tracked dimension and save them to the dashboard. Track the metrics your business actually cares about — signup-page conversion, campaign-landing bounce, download counts — without exporting anything.
AI analytics chat
Numbers become answers with the AI analytics chat: ask questions in plain language about your own data and get grounded responses.
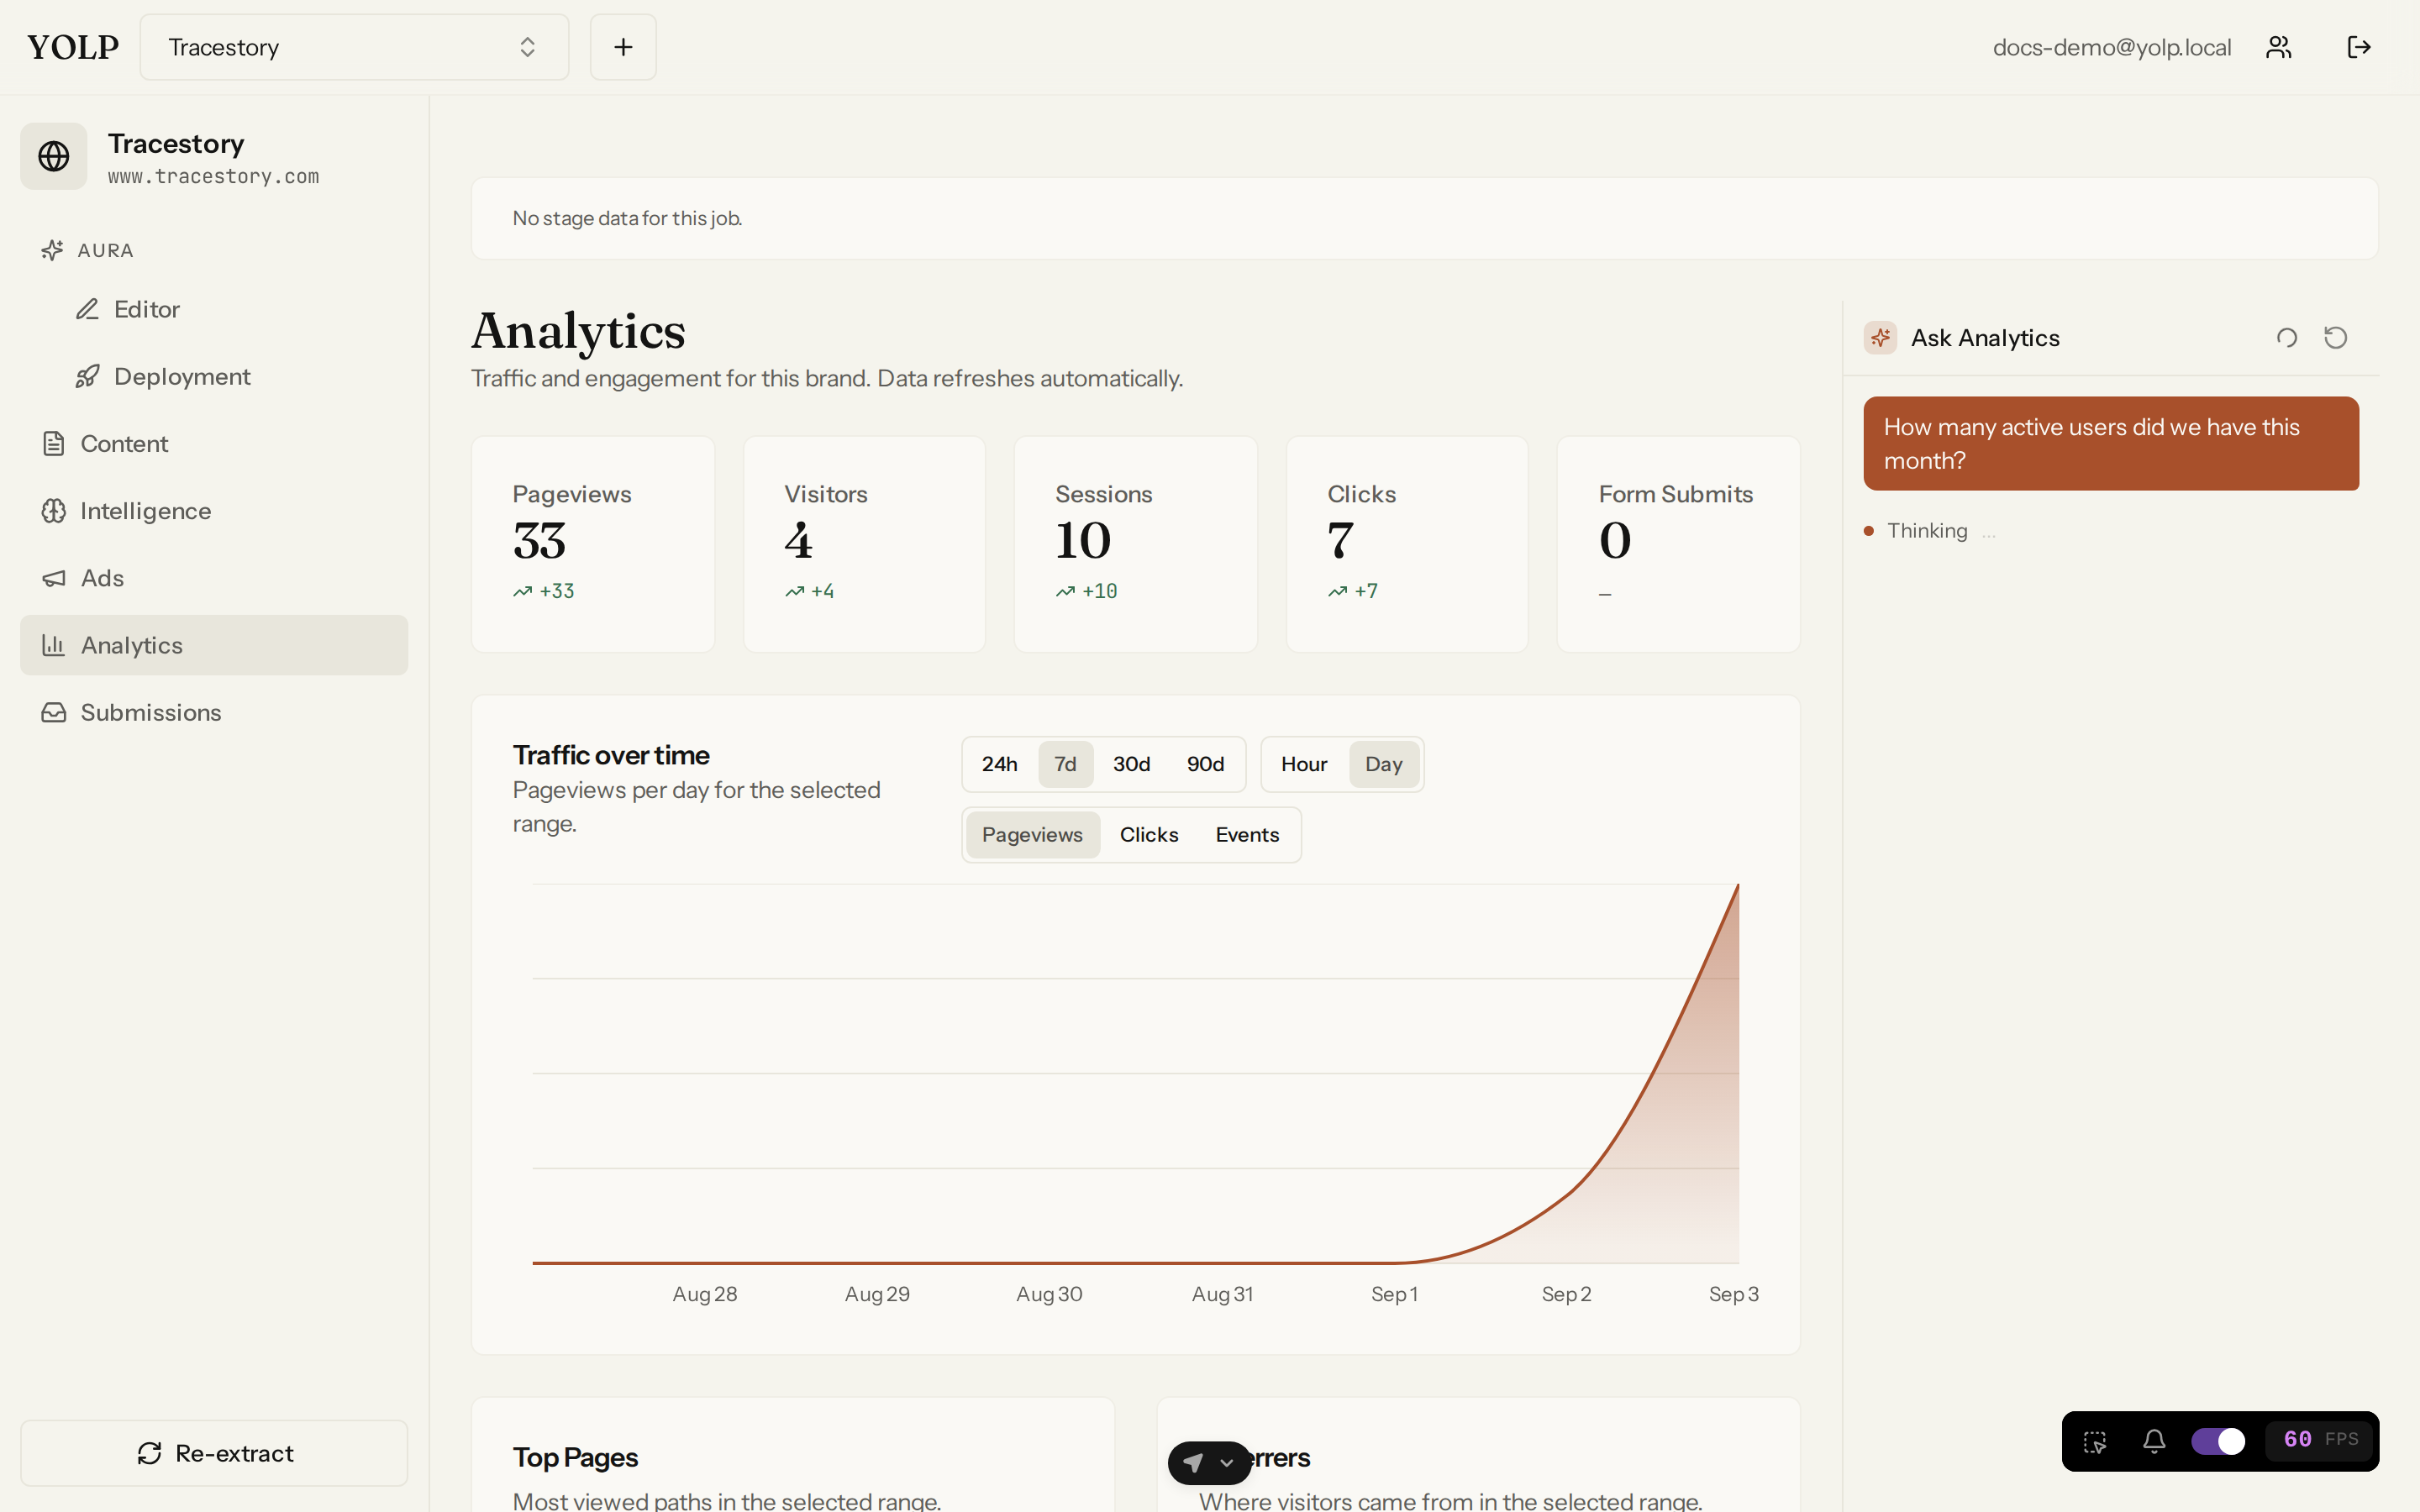
"Where did last week's traffic come from compared to the week before?" or "which page loses the most visitors?" — the assistant queries your tracked events and explains the result.

Optional GA4 forwarding
Already invested in Google Analytics? Brands can opt into GA4 forwarding: every ingested event is mirrored to Google Analytics 4 via the Measurement Protocol. It is fire-and-forget — a GA4 outage never affects your first-party data — and per-brand configurable.
Tips
- The dashboard is per brand; compare brands in the Intelligence feed instead.
- Custom charts are the fastest way to watch a new campaign land.
- Ask the AI chat before writing SQL — most questions are one prompt away.